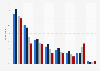
Covers the residential online population. This statistic combines four survey waves carried out in the stated time period
Supplementary notes
The respondent number is for all four survey waves combined. Gen Z classified as being born between 1995-2012. Millennials classified as being born between 1980-1994. Generation X classified as being born between 1965-1979. Baby boomer classified as being born between 1946-1964. For more information, please visit the Global Consumer Survey home page and take a look at our methodology. Figures have been rounded.
Citation formats
Consumers with food intolerances in the UK 2022/23, by generation
According to the Statista Global Consumer Survey carried out between April 2022 and March 2023 in the United Kingdom, members of the Gen Z cohort were the *********** to agree with the statement that they have one or more food intolerances. The older the respondent, the *********** they were to agree with the statement. For more countries, the results of prior surveys, and a variety of other topics, please visit our Global Consumer Survey web page.
Profit from the additional features of your individual account
Currently, you are using a shared account. To use individual functions (e.g., mark statistics as favourites, set
statistic alerts) please log in with your personal account.
If you are an admin, please authenticate by logging in again.
Learn more about how Statista can support your business.
Statista. (November 22, 2023). Share of consumers with one or more food intolerances in the UK in 2022/23, by generation [Graph]. In Statista. Retrieved September 09, 2026, from https://www-statista-com.libproxy.pcc.edu/forecasts/1388053/prevalence-of-food-intolerances-in-the-uk-by-generation/
Statista. "Share of consumers with one or more food intolerances in the UK in 2022/23, by generation." Chart. November 22, 2023. Statista. Accessed September 09, 2026. https://www-statista-com.libproxy.pcc.edu/forecasts/1388053/prevalence-of-food-intolerances-in-the-uk-by-generation/
Statista. (2023). Share of consumers with one or more food intolerances in the UK in 2022/23, by generation. Statista. Statista Inc.. Accessed: September 09, 2026. https://www-statista-com.libproxy.pcc.edu/forecasts/1388053/prevalence-of-food-intolerances-in-the-uk-by-generation/
Statista. "Share of Consumers with One or More Food Intolerances in The Uk in 2022/23, by Generation." Statista, Statista Inc., 22 Nov 2023, https://www-statista-com.libproxy.pcc.edu/forecasts/1388053/prevalence-of-food-intolerances-in-the-uk-by-generation/
Statista, Share of consumers with one or more food intolerances in the UK in 2022/23, by generation Statista, https://www-statista-com.libproxy.pcc.edu/forecasts/1388053/prevalence-of-food-intolerances-in-the-uk-by-generation/ (last visited September 09, 2026)
Share of consumers with one or more food intolerances in the UK in 2022/23, by generation [Graph], Statista, November 22, 2023. [Online]. Available: https://www-statista-com.libproxy.pcc.edu/forecasts/1388053/prevalence-of-food-intolerances-in-the-uk-by-generation/